Network Anomaly Detection PoC for a Major European Telecom
The Challenge
The operator's network operations team was working through alerts from siloed monitoring systems. Dashboards could not correlate events across fiber-to-the-home network layers or suggest a root cause, so incident resolution was slow.
How it was built
A Celery beat job published a batch of fiber-to-the-home telemetry to RabbitMQ: readings from ONUs, PON ports, and OLT line cards. A second scheduled job picked the batch up and ran it through three LLM agents. The result landed on a Grafana dashboard, and an engineer could ask about it in a chat window.
This was a six-month proof of concept built by three engineers. It ran on synthetic telemetry shaped like the operator’s device data, not on live network traffic. That limits what it proves, and I come back to it at the end.
The pipeline: Sense, Think, Act
Celery beat -> RabbitMQ -> Sense  (find anomalies in raw rows)
                        -> Think  (correlate, root cause, priority, next best action)
                        -> Act    (tool calls: reboot ONU, reset ONU config, open Jira ticket)
                        -> MongoDB -> Grafana dashboards, Open WebUI chat
Each stage is one prompted LLM call with a narrow job. Sense gets the raw rows (column names plus values) and returns the anomalies it sees. Think takes those anomalies and returns a root cause, a priority, and a recommended action. Act turns the recommendation into LangChain tool calls on Azure OpenAI, with exactly three tools available: reboot a device, reset its configuration, or open a Jira ticket. Keeping the tool list that short made its behavior easy to reason about.
The orchestration is plain Python driven by the queue, with every stage’s output written to MongoDB under one workflow ID so any run can be reconstructed afterwards.
My part: making it usable by operators
My share of the work was the layer the operations team would actually touch.
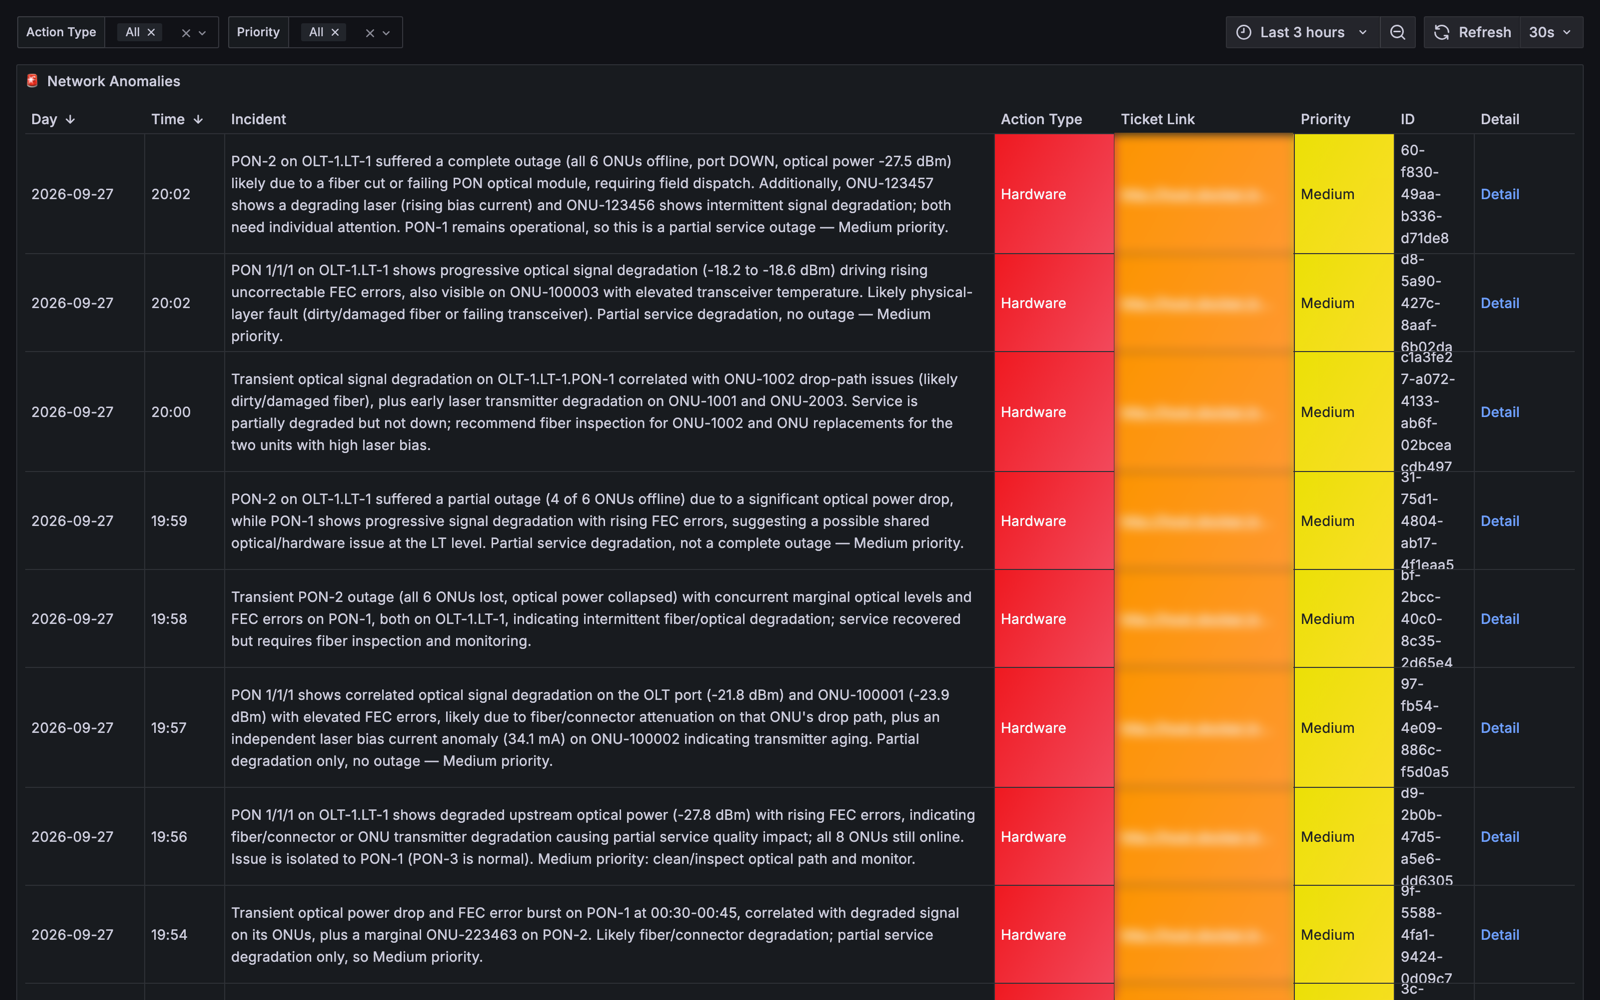
Dashboards. I built the Grafana dashboards for network anomalies, the incident list, and incident details, with drill-down from a dashboard row to the individual agent run that produced it. The API exposes agent activity as Prometheus metrics, and a formatter turns each agent’s JSON output into the fields the panels need.
Chat. I integrated Open WebUI through an OpenAI-compatible endpoint on our API. Before a question reaches the model, a context builder routes it by intent: device questions pull recent incidents per device, trend questions pull anomaly counts and severity over two weeks, summary questions pull 30-day statistics. The results go into the context from MongoDB aggregations. There is no vector index, because the questions engineers asked were aggregations, not document searches. Preset quick actions cover the common ones: current high-severity anomalies, recent root-cause analyses, and the status of today’s actions.
Deployment. I wrote the script that stands the whole system up on Azure Container Apps (virtual network, NAT gateway with a static outbound IP, RabbitMQ, MongoDB, the API, Prometheus, Grafana, and Open WebUI) and made it idempotent, so running it twice changes nothing.
A feedback loop on the prompts
Engineers could rate each agent’s output. I added the feedback API, and the team built a loop on top of it. Every ten workflow runs, an error-handling agent computes the share of bad ratings for each agent. Above 30%, an LLM rewrites that agent’s system prompt, the new version is saved to Azure Blob Storage (with prompt storage enabled, agents load the latest version), and a Jira ticket records the old and new prompt for a human to review.
For a PoC this was a good way to show the idea. For production I would reverse the order: a revised prompt should pass an evaluation set and get human approval before any agent uses it, not after.
What the PoC did and did not show
It showed the full loop working end to end: telemetry in, anomalies found, actions taken through tools, results visible to engineers, and feedback flowing back into the prompts.
It did not show accuracy. Synthetic data came without labeled incidents, so operator ratings were the only quality signal, and there was no number to report for precision or recall. The next step I would push for is a labeled replay set from real incidents, so every prompt change and model change can be scored before it ships.
The Outcome
Sense, Think, and Act agents with tool calls for ONU reboots, config resets, and Jira tickets
Grafana dashboards for anomalies, incidents, and agent activity, with drill-down to individual runs
Open WebUI chat grounded in incident records for plain-language investigation
Feedback loop that drafts a revised agent prompt when more than 30% of recent outputs are rated bad
Technologies
Want the technical detail?
I'm happy to walk through the architecture, the trade-offs, and what I'd do differently next time.