Knowledge Graph for a Global HealthTech Support Knowledge Base
The Challenge
A global healthtech company had tens of thousands of Salesforce knowledge base articles across their product portfolio. Content was outdated, duplicated, and impossible to query across product domains. Manual quality audits could not scale.
How it was built
The input was a Salesforce CSV export: tens of thousands of support articles across a large product portfolio, each with translations into many locales. The client was moving the knowledge base to a new platform and needed to decide, article by article, what to migrate, what to merge, what to fix first, and what to drop. Nobody could answer that by reading.
I built the system on my own over three months: ingestion pipeline, graph, API, editor UI, chat agent, and monitoring.
What editors needed
Editors did not need a chatbot first. They needed ranked lists: the least complete articles, the stalest, the likeliest duplicates, the master articles with missing translations, the articles filed under the wrong product. So the core of the pipeline is a scorecard computed for every article:
- completeness and structure against the sections expected for that article type
- staleness, from last update and view counts
- duplicates, detected at chunk level with a similarity score, split into identical and near duplicates
- translation coverage against each master article’s target locales
- product-code consistency, broken links, contradictions, and spelling
Completeness is scored by an LLM by default, with a heuristic scorer behind a flag, so a run can still finish when the model is unavailable.
Pipeline
Salesforce CSV export
  -> parse, filter, and enrich with product metadata
  -> per-article scorecard
  -> graph: MasterArticle, ChildArticle (translations), Product, ProductFamily,
            ProductCategory, Locale, Chunk
  -> FAISS index for semantic retrieval
  -> timestamped run folder: quality report, editor toplists, translation parity,
     filtered records
Every run writes its artifacts to its own folder, and the API serves them, so any number on screen can be traced back to the run that produced it. Records the filters dropped are written out too, with a reason, instead of disappearing.
I prototyped the graph on Neo4j, then moved it to the production target, Azure Cosmos DB with the Gremlin API.
The write path decided the cost
On Cosmos DB every operation costs request units and a network round trip, roughly 200 to 400 milliseconds each from the ingestion host. Writing a product and its edge one operation at a time took about 0.58 seconds per product.
Batching changed that. Upserting ten vertices went from 11.58 seconds to 1.49 seconds (7.8x) at the same 24 request units per item, and creating ten edges went from 11.42 to 1.96 seconds. A synthetic benchmark had predicted a 6 to 8x gain for mixed product and edge writes. The real service gave 3.6 to 4.5x, because server-side work inside a large batch is not free. I only trust numbers measured against the real service now.
To keep large runs predictable, each ingestion stage has a request-unit budget. Prometheus alerts when consumption stays above 80% for five minutes, and a Grafana panel projects total runtime for 100, 1,000, 10,000, and 25,000 articles before anyone starts a big batch.
A graph nobody can load
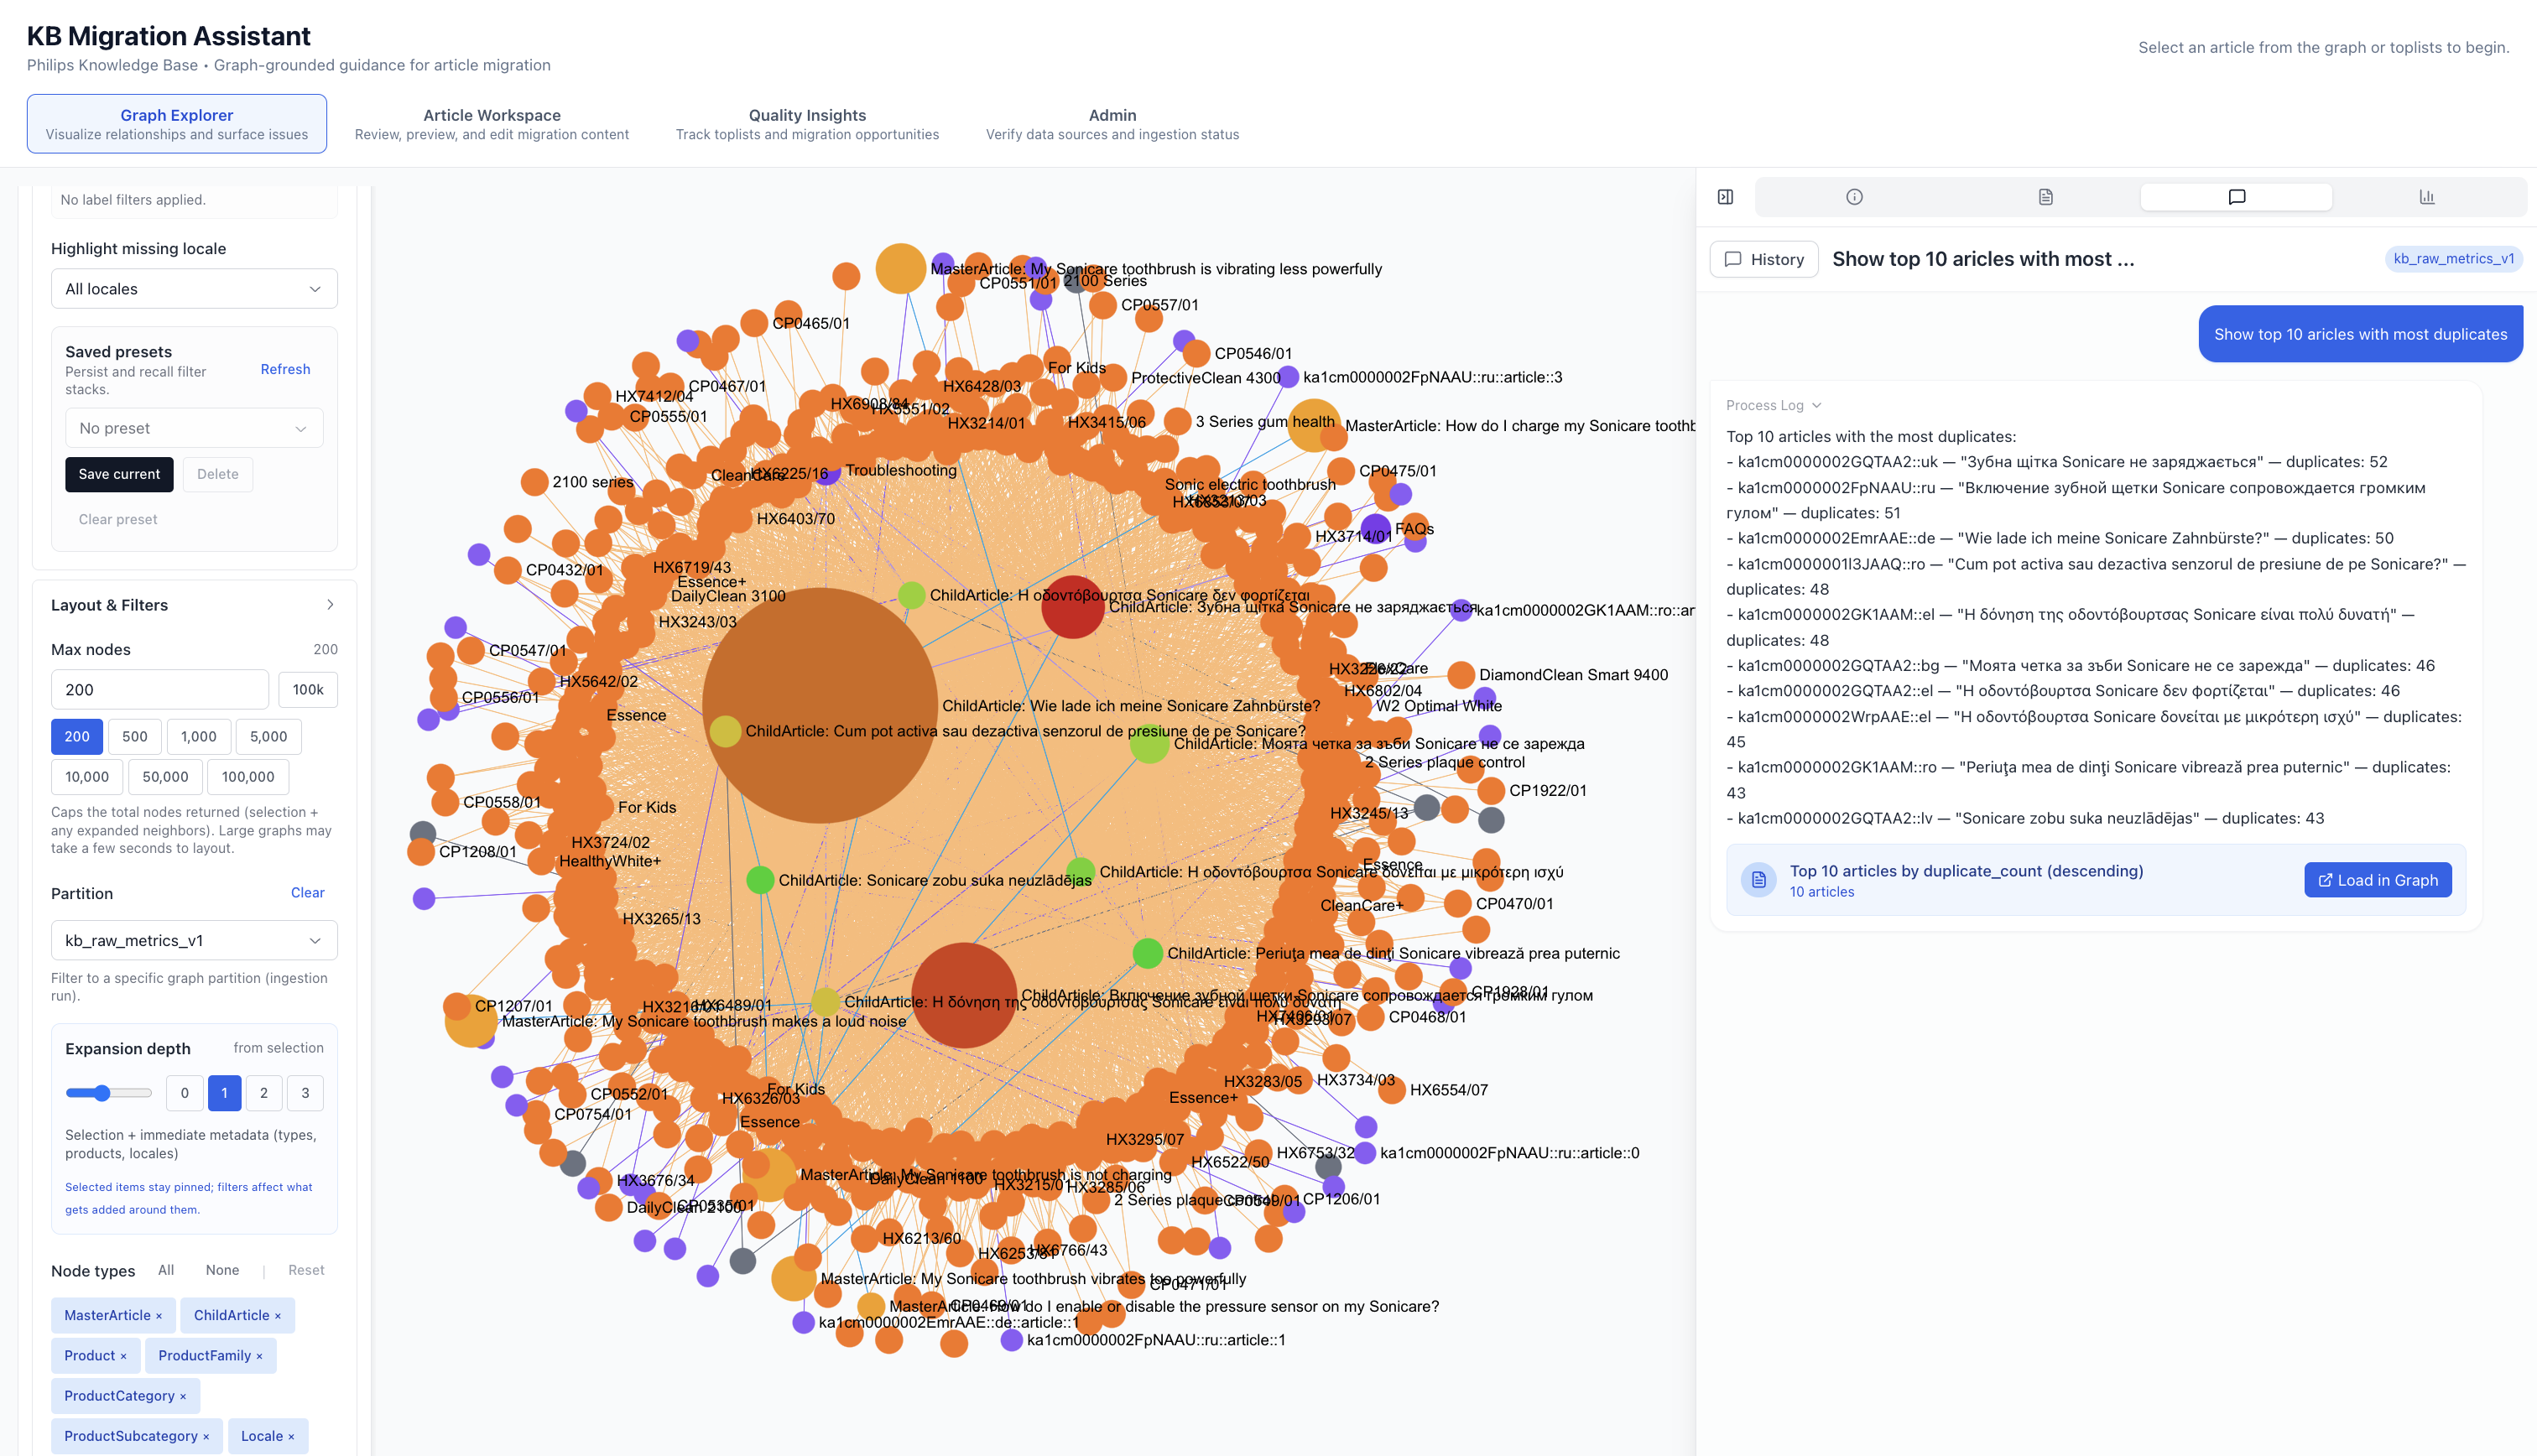
My estimate for the full graph at 25,000 articles was 30 to 150 MB of JSON, depending on edge density. No browser renders that usefully. The explorer therefore asks the backend for a filtered subgraph: 100 nodes by default, expandable one to three hops from a selection, and filterable by node type, locale, and ingestion run. Sigma.js renders what comes back. The quality views work from the precomputed toplists, not the graph, so they stay fast regardless of size.
The chat agent
The chat is a Semantic Kernel agent on Azure OpenAI with one plugin exposing the graph: Gremlin queries, schema lookup, semantic search over the FAISS index, and duplicate lookup for a given article. An editor can ask for the ten articles with the most duplicates and load the answer straight into the graph view. Every model call is traced in Langfuse. The same client also runs against OpenAI or a local Ollama model for development.
What I would do differently
I would benchmark the write path against the production database in week one, before designing the pipeline around it. The batching work was the single biggest performance win, and it came late.
I would also have split article labels into master and translation types from the start. Replacing a generic Article label with MasterArticle and ChildArticle late in the project touched queries, components, and tests across the whole codebase.
The Outcome
Per-article quality scorecard: completeness, structure, staleness, duplicates, translation coverage, broken links, contradictions
Tool-calling chat agent (Semantic Kernel, Azure OpenAI) over the graph and the vector index
Batched graph writes cut vertex upsert time 7.8x (11.6s to 1.5s per 10 items)
Request-unit budgets, Prometheus metrics, and Grafana dashboards for every ingestion stage
Technologies
Want the technical detail?
I'm happy to walk through the architecture, the trade-offs, and what I'd do differently next time.